STARLIGHT (VIXX) SURVEY RESULTS
- Livia

- Jan 20, 2019
- 13 min read
Updated: Jan 21, 2019
Overview:
First off, I'd like to thank everyone who took part and shared my initial survey. It really amazed how far this survey made it.
Second off, I'll be explaining a few things about this analysis. You are welcome to skip this section if you're not interested, but it might help clarify a few things if I do not mention it for each section.
The results of this survey in no way are meant to be taken as a point of fact. Statistics are meant to be a tool used to predict results, within a reasonable amount of uncertainty.
All of this data is qualitative which made certain analysis extremely difficult. I did the best that I could, but please understand that because this is qualitative, and not quantitative, certain tools of statistical analysis have been omitted.
The programs used in this were MicroSoft Excel (where the data was compiled) and R (a statistical analysis tool used to create the graphs).
This analysis will mainly focus on the Members in comparison to everything else. I felt that this was a good stopping point and its a point in question that most people are interested. (Besides, I think I was done when I hit roughly 50 graphs, not all of which where used here)
Shortcomings of this project:
As you will see later that the distribution of my data is not ideal. Part of the reason for this is that I was fighting the influence of what I call "Data Ghettos" that social media site puts each user into. For this reason, you see the influence on my demographics (located in the USA, primarily an English speaker, early 20s) since I reached out to people initially within my data sphere. I will say that I believe I did fairly well in trying to get out of this "Data Ghetto".
The primary chart type for this presentation unfortunately is the Pie Chart. The pie chart does not do a good job of allowing us to compare multiple proportions against each other, unlike a bar plot. Unfortunately, I was unable to get R to present me with a clear bar plot (that is, it would not allow me to manipulate the graph in such a way that someone other than myself could understand what it was presenting).
There is a lot I did not analyze, that could've. But at that point, there was no way I was going to get this project done in a long weekend. At that point this would have been essentially a job work load since I do this alone. And too much analysis is not necessarily helpful, so I mostly focused on what I think people would be the most interested in.
Any other shortcomings of this project will be mentioned in each section as they will be section specific.
Members:
This is probably one of the biggest talking points of discussions that I have come across: Who is the most popular member of VIXX? Well, here are the numbers:
Leo — 207
N — 191
Ravi — 106
Hongbin — 85
Ken — 74
Hyuk — 66
A trend that I hope to confirm after running several surveys is to confirm whether or the Hyung Line (older half of a group) are in the top positions of popularity. From this particular survey, it is mostly true. Both and N and Leo are in the top 2 positions, with Leo over taking N in the last few days of the survey being open. Over 50% of correspondence ranked either one of them as their favorite. I was surprised by the drastic drop (over 80 votes) between the top two positions and the rest.
For the other four (Ken, Ravi, Hongbin, and Hyuk), I was a little surprised by the final count. Based on the research and the opinions of others, I was expecting to find Ken in third or at the very least, in fourth place, not leading far too behind third. I had not expected Ravi AND Hongbin to be in front of Ken. My best guess for this is as the following: Ravi is very active with the international fans, it would make sense for people to gravity towards someone who can speak with them in their language. The only reason I can come up with as to why Hongbin is further ahead of Ken is that he's has more international exposure because of his dramas, while Ken's main source of exposure (outside of his work with VIXX) are musicals.
As to be expected, Hyuk comes in last place. From the trend that I've noticed, it's typical for the youngest not to be the most popular. In the case of VIXX (since, in my opinion they're work distribution as a group is currently pretty fair), I believe that the reason for Hyuk's position is that as the youngest, he's had less exposure. Since he's finished college, he's been more active in the past year. It's to be expected that his popularity would not increase over night. (Side note: I kept tabs on whether or not his popularity would increase with the release of his solo "Boy with a Star", and I found that there was no statistically noticeable change in the inflow of my data.)
Something I would like to bring up is something I want to explore further over my next several surveys. I have theory that I'm going to called the "Leader Fallacy." It's where the leader of the group's numbers are inflated. I believe that there is inflation for two reasons:
The leader is the face of the group, people are more likely to gravitate towards them for this reason.
If they are a casual fan, or they can't pick a favorite, they may unconsciously pick the leader as they are a safe and established point of reference.
I cannot definitively answer this question until I can find a way to measure whether or not someone is a casual fan or not. And a way to discover why someone chose a particular member (I want to avoid having paragraph answers as it gives people too much to time second guess themselves and to logic their way to a reason).
I'm very excited to see how this would change over the several months with N and Leo going away to their enlistment.

Countries:
Before I begin with this one, I just want you guys to know, this section took me the longest to try to analyze. Because of the number of different country response (63 different countries) I have presented the data in two different way (since R could not produce a clean pie chart with this many responses):
The first is a table with all the countries in alphabetical order. If the country comprised of 1% or more of the data submitted, I highlighted it in green.
The second is a bar graph of the frequencies of each country. I apologize for the small font of the bar graph. It is also presented in alphabetical order.


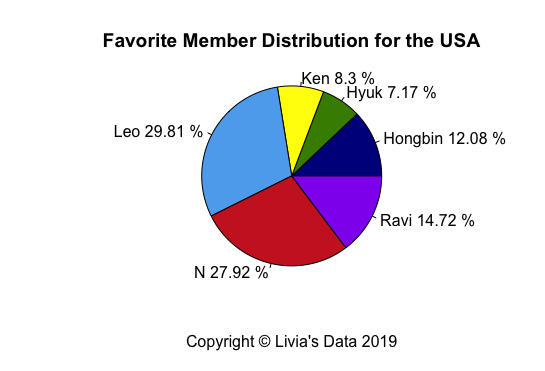
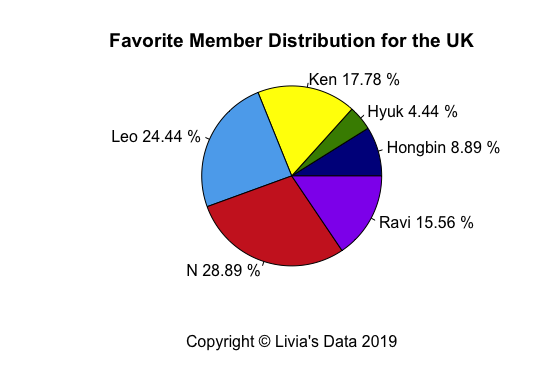
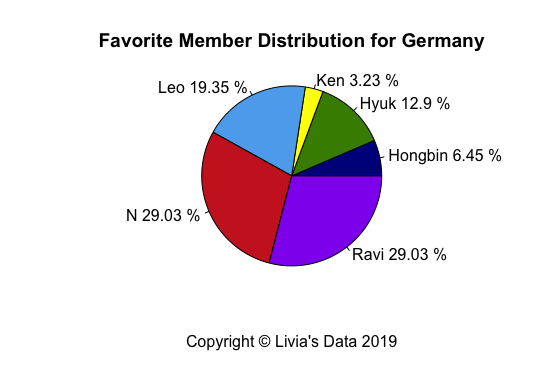
Favorite Member for the Top Three Countries:
A key point in statistical analysis having a large enough sample size to represent a population. I have chosen to go with the rule of thumb of a minimum sample size of 30 to prediction a population. There were only three countries from which I got 30 or more responses: Germany, the UK, and the USA. I will not do a detailed analysis of these charts as they are self explanatory and are kind of a repetition of the "Members" section above.
(Slideshow):


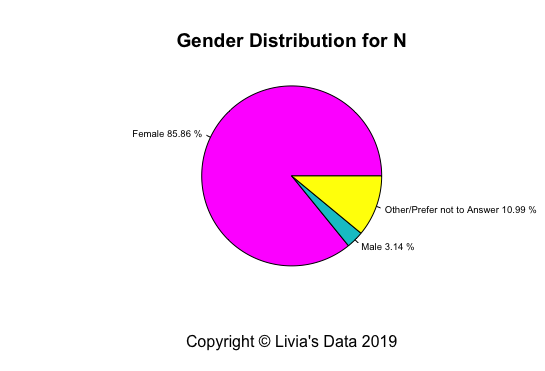
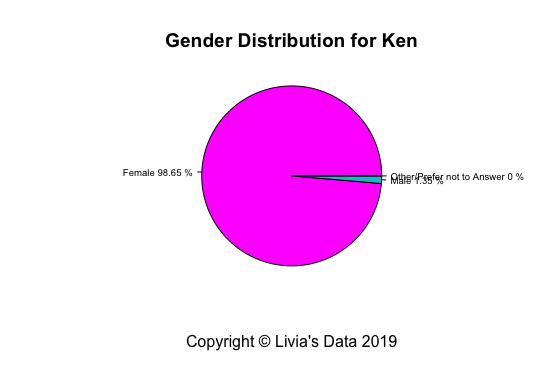
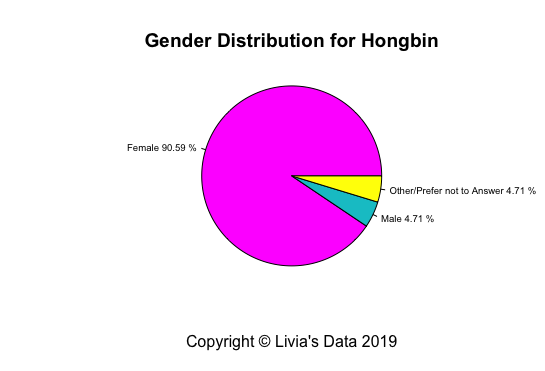
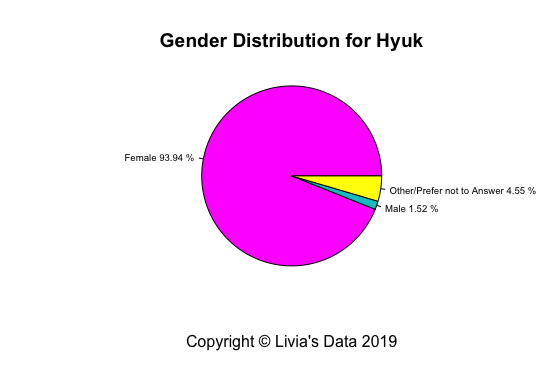
Gender:
This section was highly predictable. It was expected for the majority of participants to identify as Female. At this macro-level, there is not much for me to discuss. I will however will discuss the popularity of each member for each of the gender options. I will say that I think one of the shortcomings of this section was how poorly I wrote this question. I only realized my mistake as I was going over this section. In the next survey I publish, I will fix this shortcoming, by making it a multi-level question.
Female —667
Male — 19
Other/ Prefer not to Answer — 43

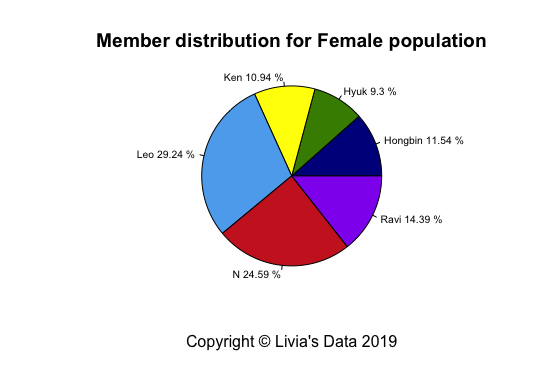
Female:
Its distribution is fairly similar to what we saw in the "Members" section above. Which would make sense as the female population accounts for over 90% of the data collected.
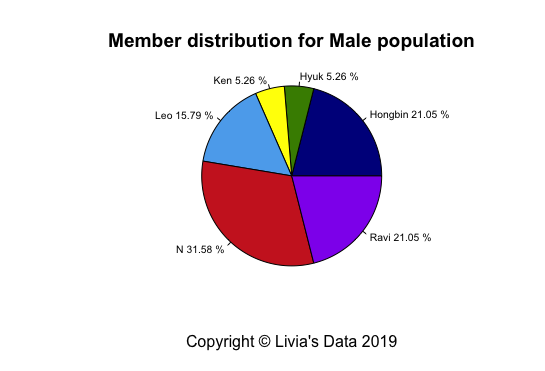
Male:
The male demographics had a similar distribution to the female one, with two key major differences: N and Hongbin has higher relative frequencies. Ravi's relative frequency was also higher, but not by much. I believe this reflects a sense of self identification. Note: I will say that this in no way reflects reality as I went ahead and created this graph anyways, even though there were fewer than 30 data points. The reason for this was I wanted some contrast with the other two populations.
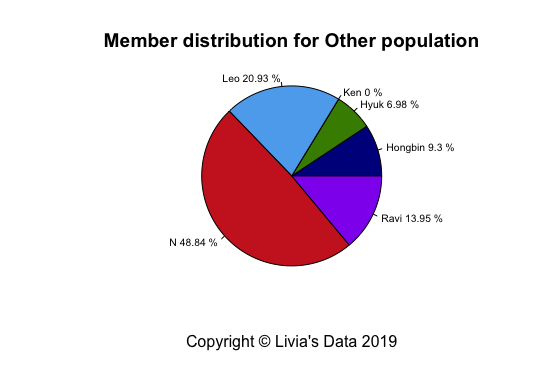
Other/Prefer Not To Answer:
This one I found to be rather interesting. Not only does N account for about 50% of the data, Ken was not voted for once. I don't know what conclusions can be drawn from this, but it's a rather interesting result.
(Slideshow):


Track:
For this section, I felt that results were up in the air as far as predictions are concerned. The only thing that I felt would be predictable was that the Japanese Tracks would have fewer votes (as they were promoted far less aggressively). Which this survey does confirm.
I will admit that I did not do as much as I would have liked with this section. Part of the reason is I don't know if there would be anyone interested in a more in-depth analysis of demographics of the lead tracks. The other part is that I wasn't sure if I wanted to do more analysis than I already have. I did NOT want to analyze this project into oblivion.
Chained Up — 56
Depend On Me — 10
Dynamite — 40
Error — 72
Eternity — 53
Fantasy — 125
GR8U — 11
Hyde — 24
Love Equation — 12
On and On — 49
Reincarnation — 7
Rock Ur Body — 10
Scentist — 61
Shangri-La — 59
The Closer — 71
Voodoo Doll — 69

Site taken:
This was more of something for myself to keep track of. I only created a chart of this in case anyone was curious where I got my data from. I probably could've analyzed if there was a difference in the distribution of favorite band member for Tumblr and Twitter, but once again, I did not want to analyze this into oblivion.
Other — 6
Tumblr — 419
Twitter — 302
YouTube — 2

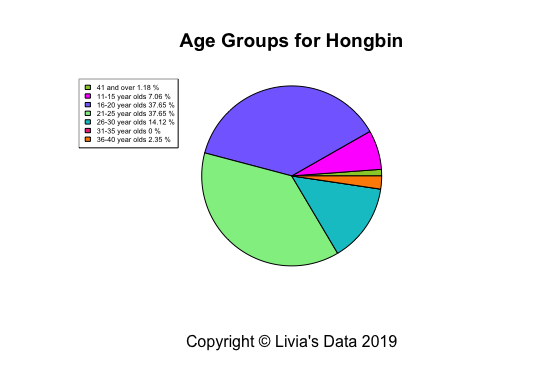
Age:
This one had a similar problem to the "Country" section: a large variety of results. Therefore I've set it up in a similar fashion: a chart with the raw numbers and as a bar graph showing the relative frequencies.
The results of this one were pretty predictable with the majority of takers being in their late-teens and early 20's. I was pleasantly surprised to see the large range of ages seen below.

As you can see below, age is a quantitative set of data, which allows me to get down into the a little more nitty-gritty analysis. Below are the numbers that I calculated. After these numbers I will explain what they mean and a few more thing about the graph below. I understand that it's a little too technical, so if you're confused at all, you're welcome to skip, this is just for those who would like to know a little more about what's going on in the chart.
Mean: 22.06
Median: 21
Standard Deviation: 5.41
1st Standard Deviation Range: [16.65, 27.47]
2nd Standard Deviation Range: [11.24, 32.88]
3rd Standard Deviation Range: [5.83, 38.29]
95% Confidence Interval of the Mean: [21.66, 22.45]
Because the mean (average) and median (middle) are pretty similar, I can draw the conclusion that the data is close to being normally distributed. The data is skewed to the right, but the weight of the left does balance it out, allowing for a mostly normal distribution. The 1st Standard Deviation Range (where 68.3% of the data lies) is between 16.65 and 27.47. The 2nd Standard Deviation Range (where 95.5% of the data lies) is between 11.24 and 32.88. The 3rd Standard Deviation Range (where 99.7% of the data lies) is between 5.83 and 38.29. With a 95% level of confidence, the true mean of the entire population is between the ages of 21.66 and 22.45.

Now I will move onto a question that people will be more interested: who is the most popular with which age group? I will first do this doing the raw data, but will look at this again in the next section in a slightly clearer way. In the graphs below, I have this set up in a box and whisker plot.
How to interpret the box and whisker plot:
The dark middle line in the box represents the median for that given subset. The box around that line are the lower and upper 25% percent (also known as the quantiles). The relative size of these sections indicates the dispersion, i.e. the smaller the area, the more values are in that range and vice versa. The lines, or "whiskers" are the upper and lower extremes. These are the reasonable extremes that R has determined. The dots indicate outliers, because of the sample size, there is to be expected large number of outliers.
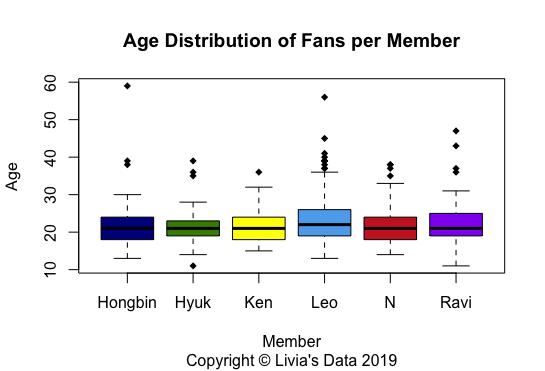
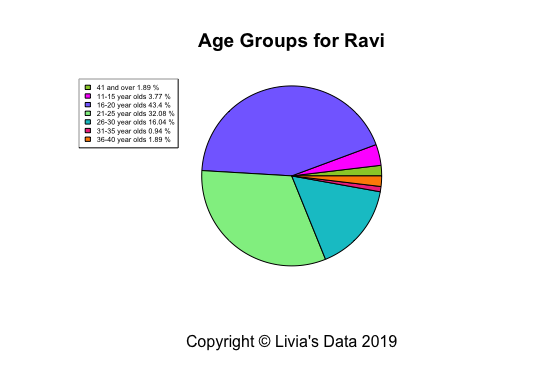
Age Distribution of Fans per Member:
As you can see in the first image, the median age of the fans for each member seems to be roughly the same. Based on this, we can see that all of them have a pretty even distribution in the middle 50% of fans, with the exception of Ravi, who seems to be more popular with those who are closer to the age of 20. It's still not entirely clear who is popular with what age group, though so far, it seems that Leo is the most popular with the older fans. I will look more into this in the next section.
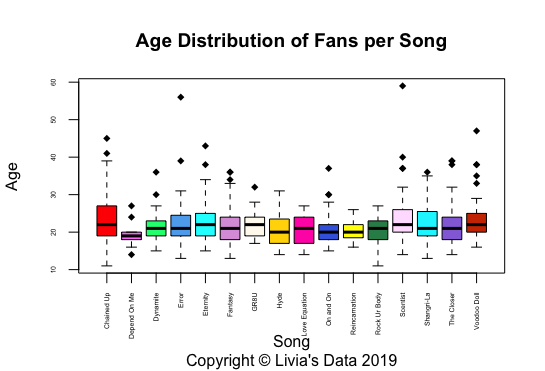
Age Distribution of Fans per Lead Track:
I've included this graph, to see if there's any glaringly obvious difference in ages preferring one song over another. As shown not really. The medians are pretty close together. It's also harder for me to say whether or not the distribution of the middle 50% is accurate for all of them as not all of the songs received 30 or more votes.
(Slideshow):


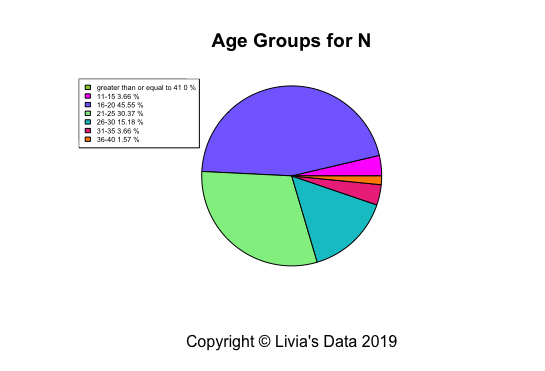
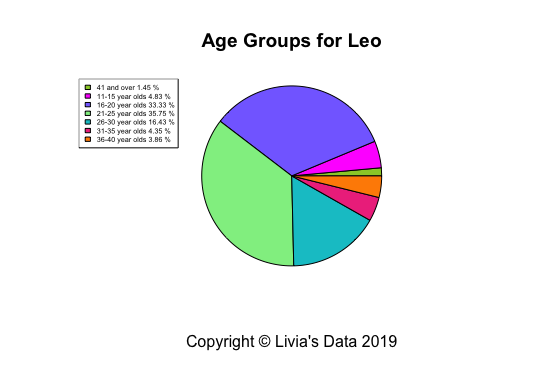
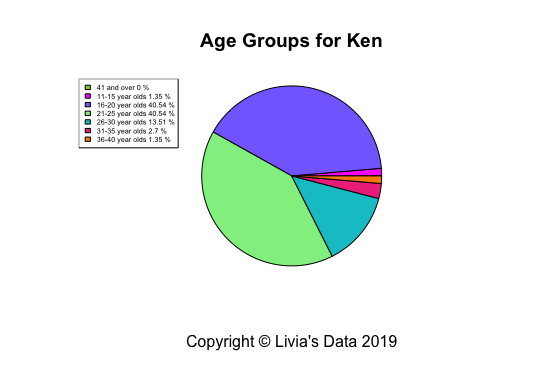
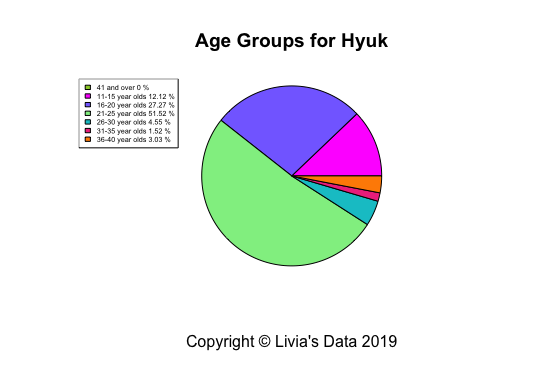
Age groups:
Because of the wide range of ages and the sheer volume, I elected to group them as the following to figure out who is the most popular with what age group.
16 - 20 years old — 282
21 - 25 years old — 262
26 - 30 years old — 105
31 - 35 years old — 20
36 - 40 years old — 18
≥ 41 years old — 6
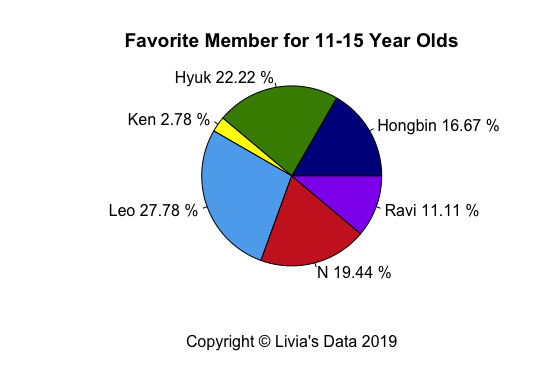
11-15 year olds:
For this age group, Leo and Hyuk are the most popular. As the most popular member of VIXX, it would make sense for Leo to rank on the upper end of this. I do think it's kind of interesting that Hyuk ranks in second place with this age group. But I do think that this does make sense as he is the closest in age to this particular group.
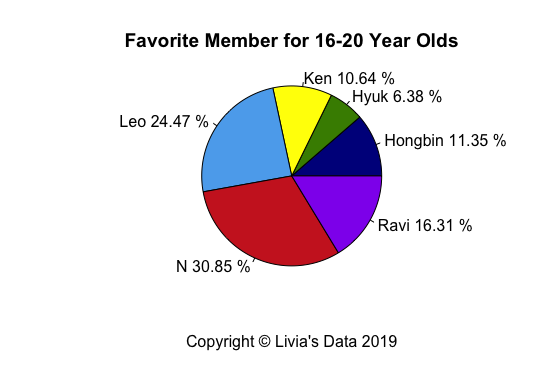
16-20 year olds:
For this age group, Leo and N are the most popular, with N having a greater lead (a little more than 6 percentage points). Other than this point, the order reflects the overall order, which makes sense as this group is within one standard deviation of the mean.
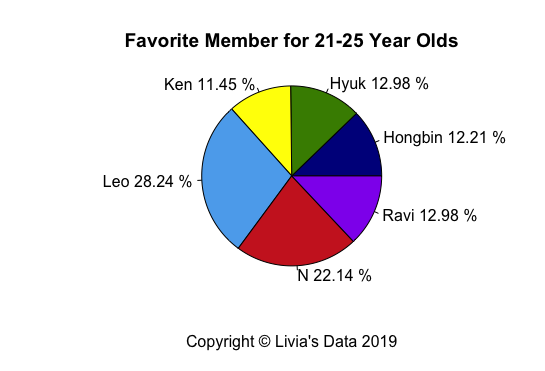
21-25 year olds:
Once again, Leo is the most popular with this age group and Ken being the least. What I found interesting with this one was that other than the two oldest members, the other 4 were statistically identical. This indicated to me an interesting preference towards someone who is older, not necessarily in the same age group.
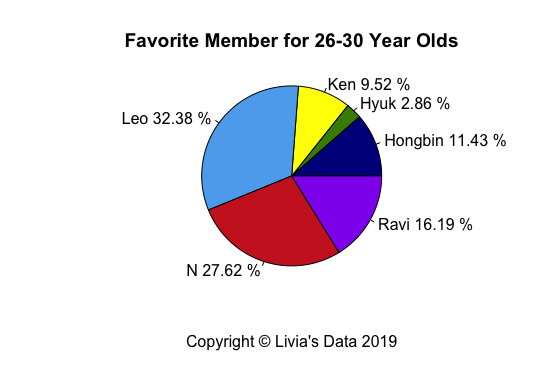
26-30 year olds:
Here we see a sharp drop in popularity for Hyuk, and an overall increase for Leo and N. This helps further prove to me that's there's an intentional preference towards someone older.
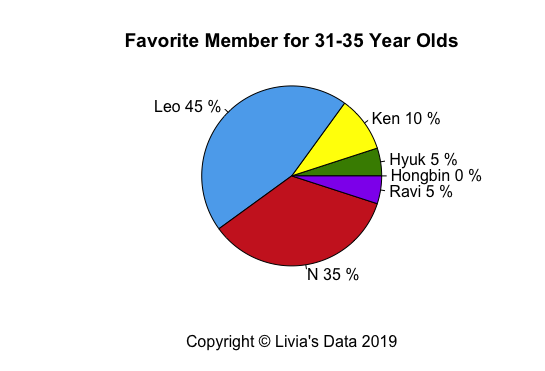
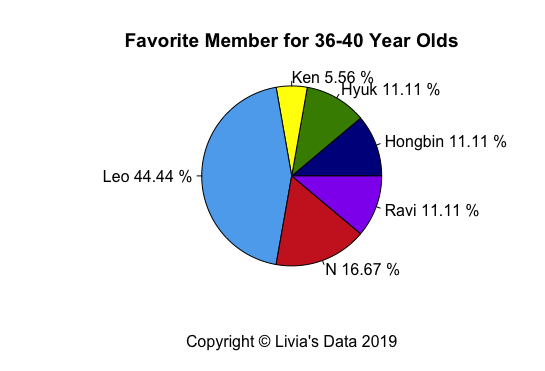
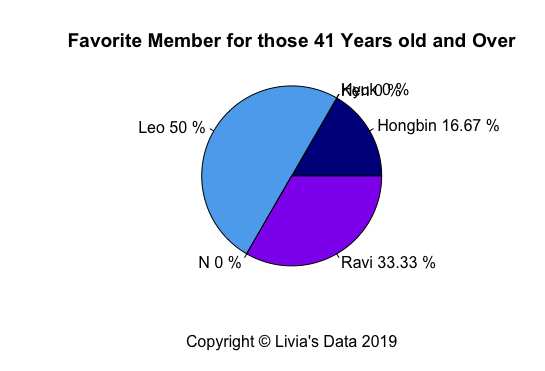
31 and Older:
So, yes, I understand that I made a chart for each age group, but because each grouping received less than 30 votes, it's harder for me to analyze. Instead I'm going to go over the trend that I see. Immediately overall, I see a drastic drop in the number of votes for the more childish members. I use that word for a specific reason. Hyuk, Hongbin, and Ken come off as more childish, part of it has to do with age, but also with just how they present themselves. This seems to not be a selling point for these older groups. Leo received consistently the vast majority of the votes for these groups and my conclusion is because he's much more fatherly than the rest of the group. N is overall in second (I know that the last group gave him 0 votes, but please keep in mind that this was the smallest group with only 6 entries) most likely because of the fact that he is the most mature of all of them. And I think Ravi comes next in this as well because he is also very mature, at least what he portrays nowadays publicly.
(Slideshow):


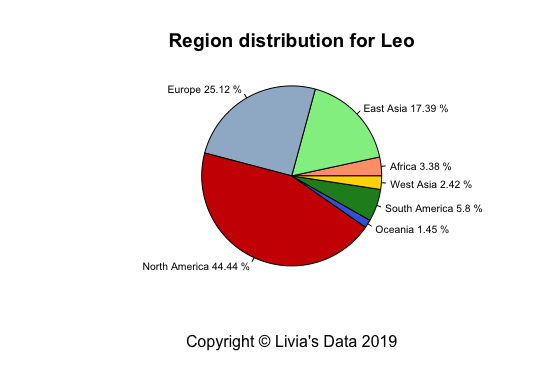
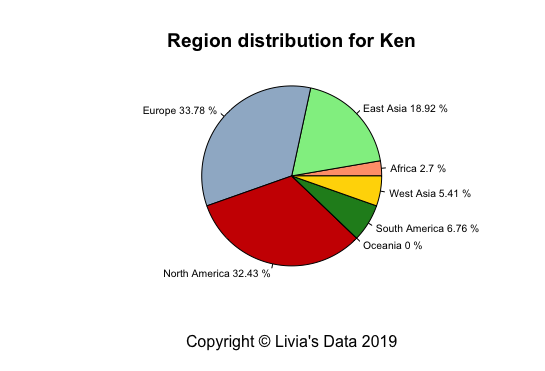
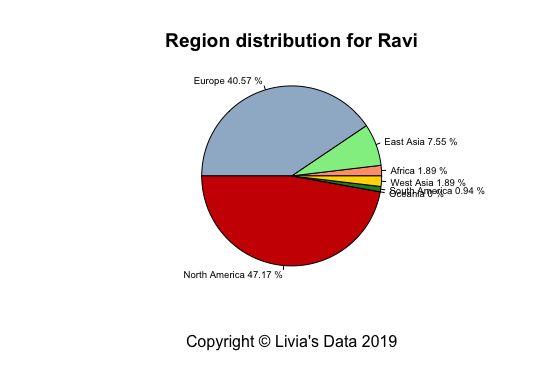
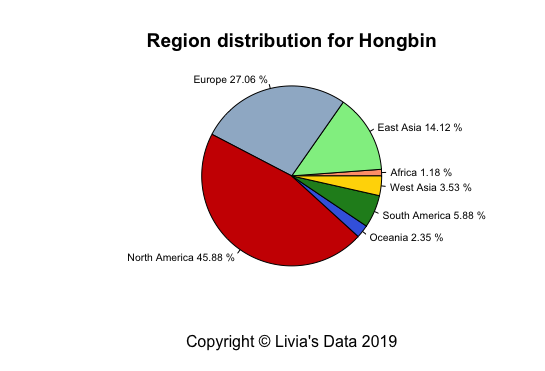
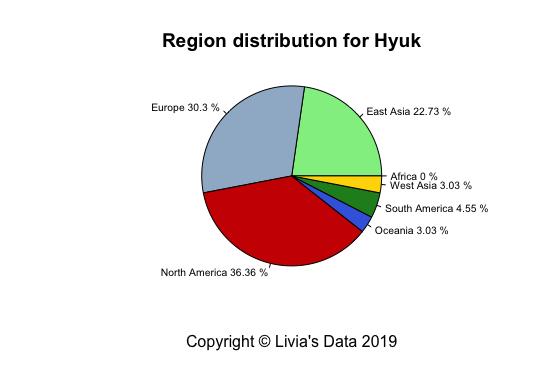
Region:
So this was something I came up with last minute since I did want to do a fair analysis of location. I feel that the graph below is pretty self explanatory. The slideshow only indicated the regions that received more than 30 votes.
Africa —15
East Asia — 115
Europe — 221
North America — 311
Oceania — 10
South America — 35
West Asia — 22

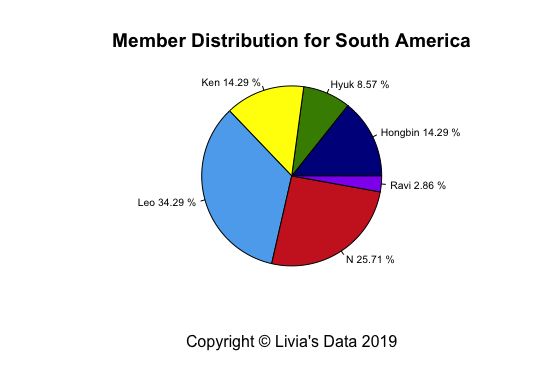
South America:
With a number of votes that were close to 30, it a little less accurate than what I would like, but I do believe that it is a good indication of what the distribution is. I did find it a little surprising that Ravi received the fewest number of votes here since he is the most active when it comes to the international fans.
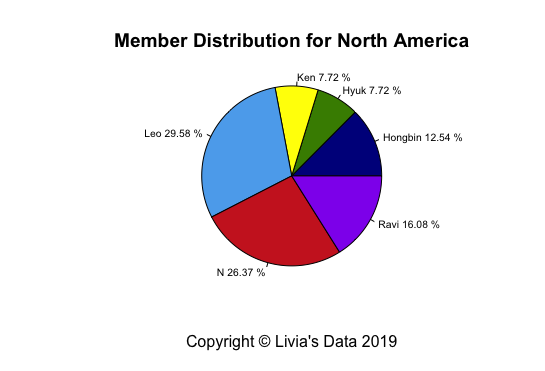
North America:
Since the majority of the participants came from this region, it would make perfect sense for this to be very similar to the overall distribution.
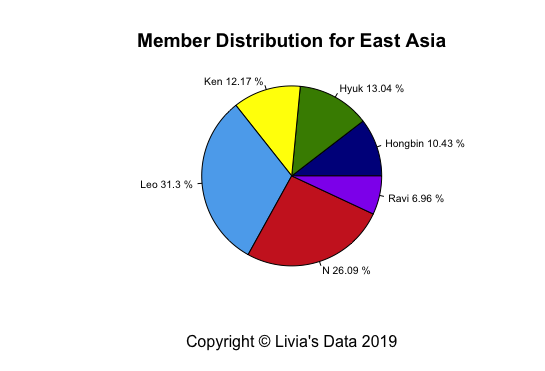
East Asia:
Here we see the Hyung Line being the more popular half. This could be an indication of cultural preference. I'm not sure why Ravi would receive the smallest number of votes for this section.
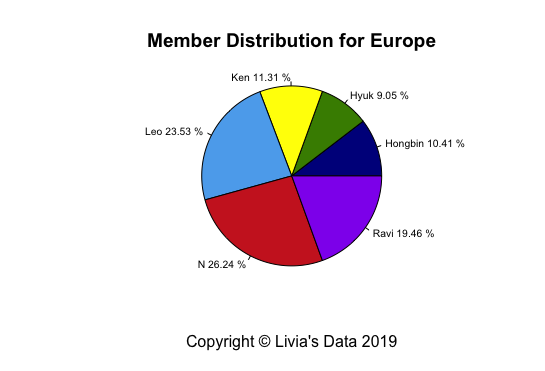
Europe:
As the second largest group, this also reflects a similar distribution to the overall popularity, with exception that Ravi has a closer popularity to N and Leo, which I believe can be explained by his recent European Tour.
(Slideshow):


Individual Members:
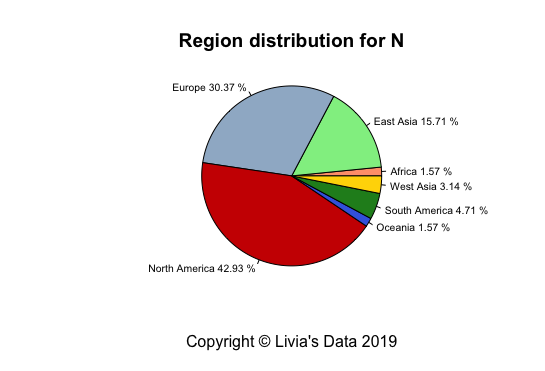
From this point on I have charts for each individual member. They reiterate my previous findings, but in a different manner. I will not be doing an explanation these unless there are some specific questions as I believe that they are self explanatory enough with the previous sections.
N (Cha HakYeon):
(Slideshow):


Leo (Jung TaekWoon):
(Slideshow):


Ken (Lee JaeHwan):
(Slideshow):


Ravi (Kim Wonsik):
(Slideshow):


Hongbin (Lee HongBin):
(Slideshow):


Hyuk (Han SangHyuk):
(Slideshow):


Ending Note:
Thank you to everyone who participated in this survey. I hope you all found this to be interesting. This was a learning experience (in case you couldn't tell) and as such, I would appreciate it of y'all would consider it as such. I am open to suggestions and criticisms on how to improve from here on out.
Also, if you're interested in more of these, please check out my other surveys (at the date of this publication, I have an ARMY survey that is open and would appreciate the participation, it can be found in an other blog post on this blog)! I am always open to group suggestions.
I will be doing a re-evaluation is about 6 to 9 months so see if there's a change in the demographics. At that point, I hope to reach a greater range of participants in Asia, in particular, Korea as they that is where a key number of fans are.
Also, thank you to everyone who shared my survey. I've tagged all the people who I know shared my survey through Twitter and Tumblr. But I would also like to thank an unknown girl in the Czech Republic for emailing my survey out to her friends and family. And to the unknown person who shared my survey to YouTube. I've been unable to find out who, so if anyone finds it or knows who posted it, I would really appreciate being linked to it so I can give proper acknowledgement.


Comments