GOT7 iGOT7 (Ahgase) Survey Results
- Livia

- May 25, 2019
- 24 min read
Updated: May 27, 2019

Overview:
For those who've been here before, welcome back and to new readers: a warm welcome! This is my second analysis and I hope y'all will enjoy it! And fair warning, be prepared to be here a while because this one is all over the place.
Before we get right to it, I'll be explaining a few things about this analysis. You are welcome to skip this section if you're not interested, but it might help clarify a few things if I do not mention it for each section.
The results of this survey in no way are meant to be taken as a point of fact. Statistics are meant to be a tool used to predict results, within a reasonable amount of uncertainty.
All of this data is qualitative which made certain analysis extremely difficult. I did the best that I could, but please understand that because this is qualitative, and not quantitative, certain tools of statistical analysis have been omitted.
The programs used in this were MicroSoft Excel (where the data was compiled) and R (a statistical analysis tool used to create the graphs).
This analysis will mainly focus on the Members in comparison to everything else. I felt that this was a good stopping point and its a point in question that most people are interested.
Please note that some of the sections do not receive nearly as much analysis as I usually do. This is because with this bare analysis this entire survey yields a monster of data and I did not want to overwhelm you all.
Also, GOT7 is not one of my main groups, so I don't know as much about them as I do for BTS or VIXX.
Shortcomings of this project:
As you will see later that the distribution of my data is not ideal. Part of the reason for this is that I was fighting the influence of what I call "Data Ghettos" that social media site puts each user into. For this reason, you see the influence on my demographics (located in the USA, primarily an English speaker, early 20s, caucasian).
The primary chart type for this presentation unfortunately is the Pie Chart. The pie chart does not do a good job of allowing us to compare multiple proportions against each other, unlike a bar plot. You'll see that there are a few bar charts, but the majority are pie charts as those are the easiest to read and understand numbers from for the greatest number of people.
And once again, there is was very little response as well from fans in Korea, so practically all of this data is based on international fan data.
There is a lot I did not analyze, that could've. But at that point, there was no way I was going to get this project done in a long weekend. At that point this would have been essentially a job work load since I do this alone. And too much analysis is not necessarily helpful, so I mostly focused on what I think people would be the most interested in.
Also I would like to apologize for long this took to get out. I've been dealing with some personal issues that have unfortunately gotten in this the way of this. Because of these issues I was unable to do as well with this project as I would have liked. When things get better I will definitely come back to this and add more things to it to make it better. Once again I apologize if this is not up to par with my other work.
Any other shortcomings of this project will be mentioned in each section as they will be section specific.
Members:
General:
This is probably one of the biggest talking points of discussions that I have come across: Who is the most popular member of any group? Well, here are the numbers:
JB ---- 165
Jinyoung ---- 97
Jackson ---- 93
Mark ---- 82
Yugyeom ---- 57
Youngjae ---- 45
BamBam ---- 42
A trend that I hope to confirm after running several surveys is to confirm whether or the Hyung Line (older half of a group) are in the top positions of popularity. For GOT7 this certainly appears like the case. There's really not much to discuss on this point, especially since the three Marketing/Placement Positions (JB is the official Center, while Jinyoung and Jackson are considered the Faces of the Group) and the official Visual (according to kprofiles.com), Mark, are in the Hyung Line.
Another quick note I'd like to talk about is that I've added a section where I asked why fans might like a particular member, so for this section, I'll be talking about reasons for popularity that are based on exposure and the like. As well as who people think are the best dancer, rapper, and vocalist of the group.
Something I would like to bring up is something I want to explore further over my next several surveys. I have theory that I'm going to call the "Leader Fallacy." It's where the leader of the group's numbers are inflated. I believe that there is inflation for two reasons:
The leader is the face of the group, people are more likely to gravitate towards them for this reason.
If they are a casual fan, or they can't pick a favorite, they may unconsciously pick the leader as they are a safe and established point of reference.
For GOT7 this certainly seems to be the case. JB as the leader comes in first place, with the Leader Fallacy probably playing a larger role in it, especially for newer fans. Some contribution factors of this can also be JJ Project (There were plenty of people who named JJ Project as a reason why they're fans of GOT7) and Jus2.
As for Jinyoung, I was not surprised by where he landed as he is a very active actor and is one of the faces of the group.
I wasn't surprised with Jackson either as he is very much the face of GOT7, especially with regards to international fans (as it turns out being able to speak three languages, Cantonese, English, and Korean, will do that to someone). The generally goofy disposition helps him as well.
For Mark, while I was expecting him to land in the middle, I expected him to have more votes, taking from the Hyung Line. Similarly to Jackson, it makes sense that his ability to speak fluent English (as he is an American by birth) certainly helps with connecting with international fans. The position of Visual helps as well. Please note that since for most of the following sections, it's hard for me determine reasons as to why he may have landed in the position that he did. It is far easier and more concise to use the middle (similarly to the mean of a normal distribution) as a reference point of comparison.
For Yugyeom and Youngjae, I was expecting them to be in similar positions but flipped, with Youngjae having the advantage of being older. I was not expecting them to rank that high as they do not seem to get as much screen time in M/V as the others. They are also just not the faces of the group since they don't have that 'pull' quality that Jinyoung and Jackson have. Despite this, in a following section there is a very interesting trend that will be examined.
As for BamBam, he landed exactly where I expected him to. For whatever reason, BamBam has received far more hate than the rest, whether this genuine or not is up to each person to decide but I do know of a few instances where the hate is definitely unjustified, usually driven by ignorance (ex. someone accused him of using a derogatory term in English, when in reality, he was saying 'I/me' in Korean). Rumors spread and it creates unintentional prejudices. That being said, I think if he was treated more fairly, we would probably see him probably closer to Mark, probably not high in ranking, but I don't think he'd be as low as he is.

Why:
For this I limited the number of reason that could be picked to 5 or less. One of the things I was very worried about was people picking all of them. By picking all of the choices that are applicable for a particular member, it makes it difficult for me to do any constructive analysis. Also since I have to type and convert the data by hand, I would have ended up with so much data that not only would I have possibly overwhelmed my program (and hard drive) I probably would have ended up aggravating the tendons in my wrist most than I already have. So from my stand point, limiting the responses to 5 was for practicality.
These choices are also based on conscious decision making. I do believe that there are other contributing factors, but they are factors that we do not typically consciously consider (ex. reputation, language barrier, etc.).
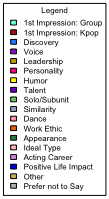
Let me do a brief explanation of what each choice indicates:
1st Impression: Group : For this one, for any people this the person that really left an impact on them when they first discovered the group.
1st Impression: Kpop : For some, GOT7 was their first group and therefore this was the first person that left an impression on them or this was the first person that left an impression on them from this genre.
Discovery: This is going to be the member that they first took notice of. However, this may not be the same member that left an impression on them when they first learned of the group but there is a bit of crossover according to the data.
Voice: Self explanatory.
Leadership: The leadership skills demonstrated by the leader. While I'm sure other members have the leadership skills, I wanted to limit this to the one that is truly in that position.
Personality: Self explanatory.
Humor: Self explanatory.
Talent: Self explanatory.
Solo/Subunit: Solos and Subunits have different focuses than the work done by the main group, so if someone prefer that member's solo or subunit works then it would be a contributing factor to why that member is preferred.
Similarity: As human beings we're drawn to those we share similar characteristics with (this can be ethnicity, sex, personality, etc.) so for many, this is a drawing point.
Dance: Self explanatory.
Work Ethic: This one was hard to decide on but I decided to include it because many are drawn to hard workers, to those who overcome difficult things and I believe this category reflects that.
Appearance: Self explanatory.
Ideal Type: I feel that this is self explanatory, but if it is not, please contact me and I will go ahead and fix it.
Acting Career: Many of them have acting experience and people may be drawn to them because of their work or discovered them through a drama or the likes.
Positive Life Impact: Life is hard and sometimes we need something to help bring us out of our slums. This can be through music. It can be through the inspiring actions of another.
Other: If there was another reason why that a particular member is a favorite but the reason is not listed then user could type that in. Full disclosure, if the answer could be recategorized into one of the other choices, I did it.
Prefer not to say: This is for those who left this section blank/did not choose an option. This is something that can happen with multi choice questions and fill ins.
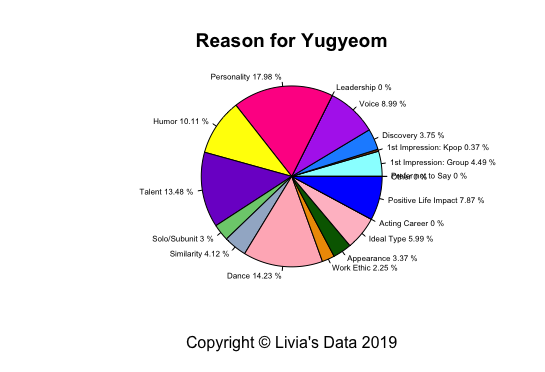
As seen in the pie chart below, the three biggest contributors overall to reasons for popularity are Personality, Talent, and Voice. This pie chart displays the overall reasoning for why a member is chosen.

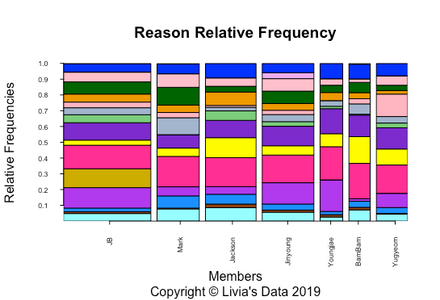
This next chart displays visually the relative frequencies as to why a member is chosen as a favorite. Unfortunately its hard to see the relative percentages in relation to each other. After the relative frequencies table, I have provided pie charts for the percentages of contribution for each member.

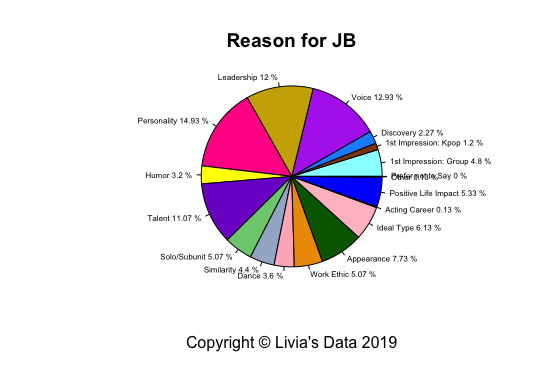
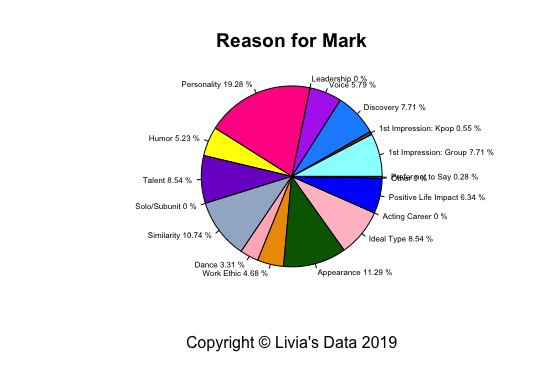
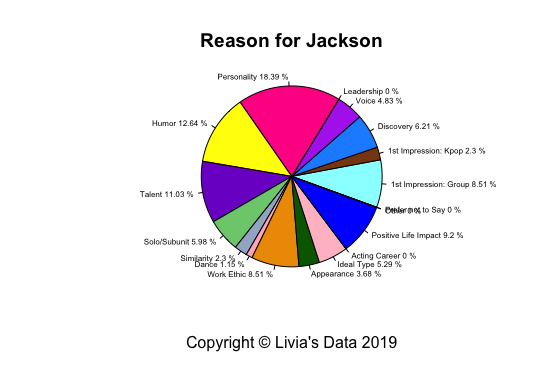
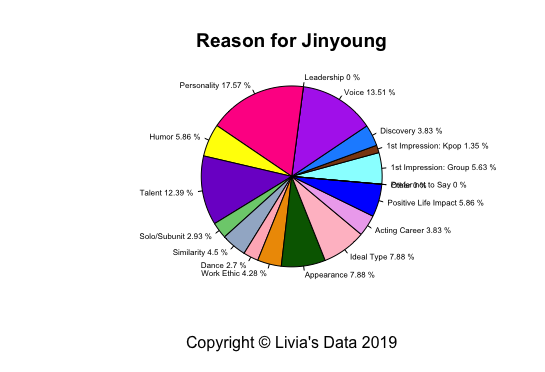
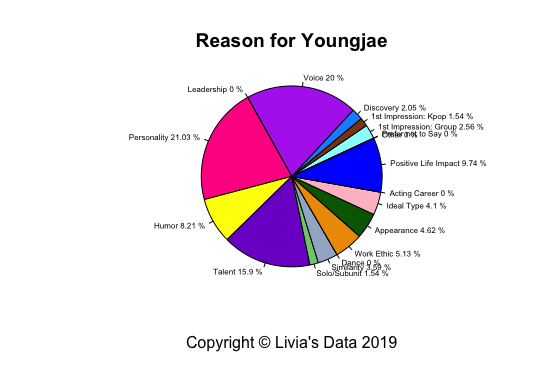
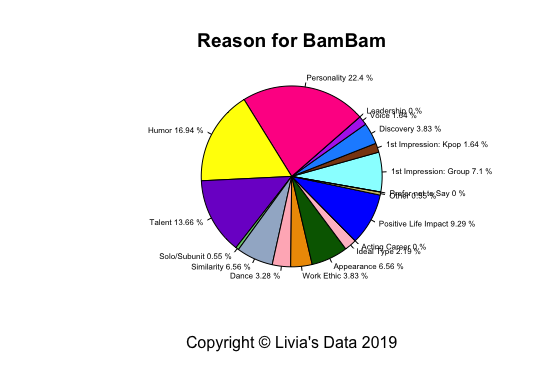
Below are the pie charts for each member. For JB, I found it quite interesting that 'Leadership' was one of the highest contributing factors to his popularity. This to me makes me believe that people really notice how he interact with his own group and with others. For Mark, I wasn't surprised to find 'Personality' to be his contributing factor as he does have this more quiet and mysterious present that many fans seem to be drawn to I noticed as well as 'Appearance' as that would make sense since he is considered the Visual of the group. For Jackson, I think that 'Personality' and 'Humor' made perfect sense as he is a complete goofball. For Jinyoung, I wasn't quite sure of what I was expecting as far as what were his contributing factors would be, but I am not surprised as what they are. I was quite surprised at the extreme distribution for Youngjae. It came out as one of the most extreme contributions I've ever seen. For BamBam, his were also extreme. Between 'Humor' and 'Personality' being his contributing factors, I think this shows that despite the rumors about him, he's got a very kind and sunny disposition. Given the following section, I was surprised to see 'Dance' being a large contributing factor for Yugyeom.
(Slideshow):


So while the pie charts do give a good representation of the percentages for each member they do not however demonstrate the percentages overall. Below I've provided two tables show casing how everything is relative to each other.
TThe first table is the Raw Data. It's a little difficult to tell, but the bolded numbers indicate the largest number for that category. For instance, for the 'Humor' column, The number 55 is bolded, indicating that Jackson had the highest number of votes for that category. The yellow cells are the categories with highest number of votes per member. For example, for all of them, the highest number of votes for any category is in 'Personality.' The greyed out cells are cells that did not get votes.
The second table is the Percentages in Relation to the Grand Total. Whatever number was in a certain cell, that number was then divided by the grand total of 2,631 entries to get the percentages. Once again the greyed out cells indicate that there was no responses. The green cells, excluding the 'Total' row, were highlighted to indicate that they contributed to more than 1% of the data collected. For the 'Total' row, the cells were highlighted if the category contributed to more than 10% of the data.

Looking at the raw data and the overall percents, I believe that it is easy to see that 'Personality,' 'Talent,' and 'Voice' are the leading conscious reasons as to why people would chose that particular member as their favorite.
Dancer vs. Rapper vs. Vocalist:
This is a new section and I unfortunately didn't foresee some of the problems that have come out of this section, partly because as I was analyzing I was realizing that there are a lot of questions... many of which I can't yet figure out how to answer. So instead for now, I'll just be looking at the basics of it. There will be no comparison between these and/or with anything else.
First is Best Vocalist. I chose the given vocalists based on whether or not they were in the official line or not. I do not include Sub-Vocalists as I believe that this adds an unfair element.
Looking at the chart below we can see that there is quite a large difference between Youngjae and the rest. I was quite surprised to find that despite the fact that Jinyoung and JB, almost half of participants named Youngjae as the best Vocalist.

Next is Best Dancer. I chose the given vocalists based on whether or not they were in the official line or not. Because there are so many members in the Dance Line of GOT7, I was almost certain that there would be a pretty even distribution. Clearly, that is not the case. Despite Yugyeom being the youngest and not ranking highly in overall popularity, he out ranks the rest by miles when it comes to dancing.

Finally is Best Rapper. I chose the given vocalists based on whether or not they were in the official line or not. I was not surprised to when it came to this section. I'll be honest, I didn't know Jinyoung was considered in the Rap Line until I was researching, so I was not really surprised to find that he was placed the lowest here. I also wasn't surprised by Jackson being almost half the votes as he in probably the best known out of the rappers.

Countries:
Before I begin with this one, I just want you guys to know, this section took me the longest to try to analyze. Because of the number of different country response (54 different countries) I have presented the data in two different way (since R could not produce a clean pie chart with this many responses):
The first is a table with all the countries in alphabetical order. If the country comprised of 1% or more of the data submitted, I highlighted it in green.
The second is a bar graph of the frequencies of each country. I apologize for the small font of the bar graph. It is also presented in alphabetical order.


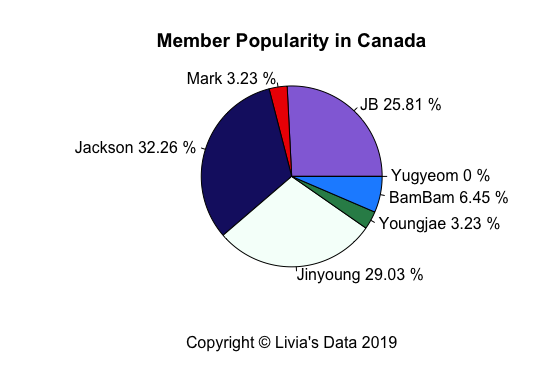
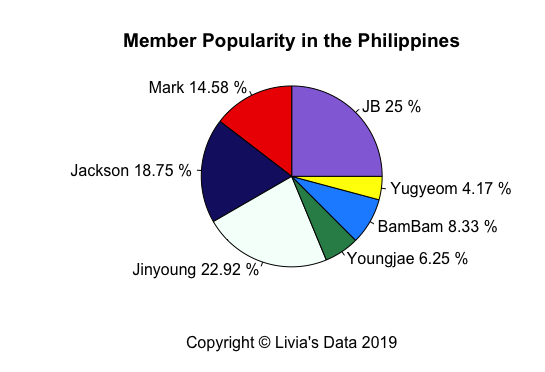
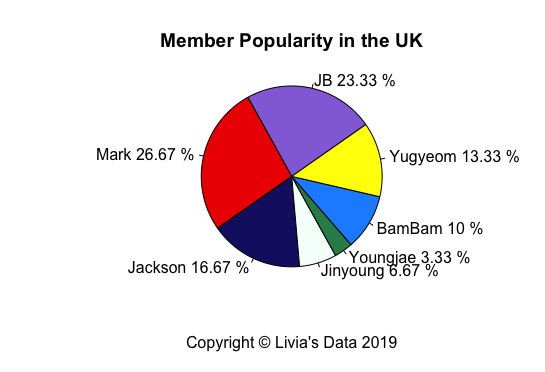
Favorite Member for the Top Five Countries:
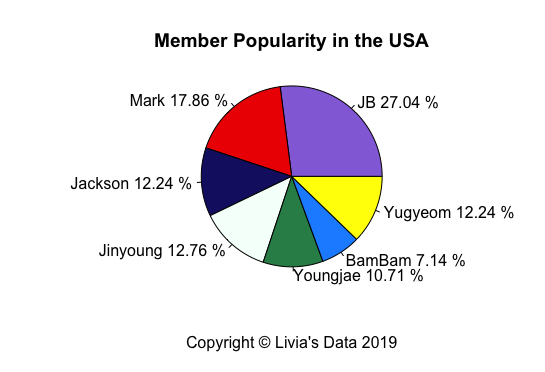
A key point in statistical analysis having a large enough sample size to represent a population. I have chosen to go with the rule of thumb of a minimum sample size of 30 to prediction a population. There were five countries from which I got 30 or more responses: Canada, Indonesia, the Philippines, the UK, and the USA. I will not do a detailed analysis of these charts as they are self explanatory and are kind of a repetition of the "Members" section above.
(Slideshow):


Ethnicity:
This was a very interesting section to create. This was a question that allowed multiple choice, I allowed unto three options. For this one, since it was a bit of an experiment, I ended up having to rework some of the answer choices. If a generic category and its subcategory were both selected, I put it down under the more specific category (Ex. Caucasian and Western Caucasian). Because no country consistently defines ethnicity, I had to come up with some of my own. I tried to find a middle ground between being generic and be specific. I wanted to add a few more options for Asian and African ethnicities by the more I researched the more I came across conflicting information and a lot information on very niche ethnicities (Ex. Tamil vs. Punjabi vs. Nepalese for South Asian sub-ethnicities). If you have any suggestions, please let me know I'll see about trying to work it in.
First, here is the break down on single answer ethnicities. Considering the locations of where I got most of my data, I found this data to be diverse.
African ---- 12
African Heritage ---- 24
Caucasian ---- 75
East Asian ---- 34
Hispanic ---- 42
Mediterranean ---- 15
Middle Eastern/ Arab ---- 11
Native American ---- 10
Mixed ---- 66
Pacific Islander ---- 3
Scandinavian ---- 15
South Asian ---- 41
Southeast Asian ---- 152
Slavic ---- 13
Western Caucasian ---- 49
Prefer not to Say ---- 19

Next is the popularity per ethnicity. For this one I was not entirely sure about how to go about analyzing given that most of the ethnicities were at less than 30 data points. But overall there seems to be a similar distribution to the overall popularity. This to me shows that there is no significant correlation between favorite member and ethnicity.

Here is the breakdown of ethnicities of those who are mixed for those that are curious.
African ---- 4
African Heritage ---- 12
Caucasian ---- 23
East Asian ---- 10
Hispanic ---- 22
Mediterranean ---- 11
Middle Eastern/ Arab ---- 3
Native American ---- 8
Pacific Islander ---- 2
Scandinavian ---- 2
South Asian ---- 4
Southeast Asian ---- 11
Western Caucasian ---- 20

Gender:
This section was highly predictable. It was expected for the majority of participants to identify as Female. At this macro-level, there is not much for me to discuss. I will however will discuss the popularity of each member for each of the gender options. For this one, I created it as a multi-level question, finding the middle ground between identity and biological sex. Female is for those who were born and identify as female. Male is for those who were born and identify as male. Transgendered is for those who were born as one sex but identify as the other. Initially I planned on distinguishing between male-to-female and female-to-male, but with how little data I had gotten, I felt like there wasn't going to be enough there for me to analyze. Other is for those who identify as something else completely. Similarly to transgendered, I wanted to add more options but for the sake of practicality I left it as simply other. Prefer not to answer is self-explanatory.
Female ---- 545
Male ---- 7
Transgendered ---- 8
Other ---- 14
Prefer not to answer ---- 7

As always, it shouldn't come as a surprise that females make up the majority of fans. Below is chart dislaying the relative frequencies. I think that if given more data, it be clearer to see if there is a trend.

Normally, I would do pie charts for each of the genders and discuss, but because female fans comprise of more than 90% of those who contributed, I felt that it was redundant to include. If you would like to see these charts, please feel free to contact me and I'll be happy to make them.
Song:
I'll first list out the tracks and their totals then I'll give a little insight into what I saw then I'll present the graphs. Let me say this now, my survey for VIXX, gave me a false sense of how easy it is to find out which songs are lead tracks, so I'm probably missing some songs for this list, 'cause your girl is no longer sure what makes a lead track anymore.
For deciding what was a lead track I cross referenced popularity on iTunes with what there were was an official MV or professional video (such as Home Run with well viewed dance practice videos and official stages).
A ---- 9
Confession Song ---- 6
Fly ---- 33
Girls Girls Girls ---- 8
Hard Carry ---- 20
Home Run ---- 11
I Won't Let You Go ---- 24
If You Do ---- 64
Just Right ---- 23
Laugh Laugh Laugh ---- 1
Look ---- 71
Lullaby ---- 48
Miracle ---- 16
My Swagger ---- 6
Never Ever ---- 42
One and Only You ---- 13
Stop Stop It ---- 9
Teenager ---- 63
The New Era ---- 4
Turn Up ---- 1
Yo Moriagette Yo ---- 2
You Are ---- 107
I felt that despite there being 22 songs on this list, I was pleasantly surprised to find that based on the number of views and comments on YouTube relatively matched the data that you see below.

Is there a trend between favorite song and favorite member?
I though that this would be a fun new section since I figured out how to make these graphs properly. To the answer the question, not in an obvious way. For some that received over 30 votes they reflect the overall popularity. For the ones that did not receive as many, I'm sure that we would find a similar trend if this was case. This tells me that the preference of song is more based on personal lyrical preference rather than personal bias towards one of the members.

Platform:
This was more of something for myself to keep track of. I only created a chart of this in case anyone was curious where I got my data from.
BLACKPINK Survey ---- 9
EXID Survey ---- 8
Future Projects Survey ---- 2
Instagram ---- 2
Monsta X Survey ---- 8
Red Velvet ---- 1
Text Message ---- 3
Tumblr ---- 256
Twitter ---- 292

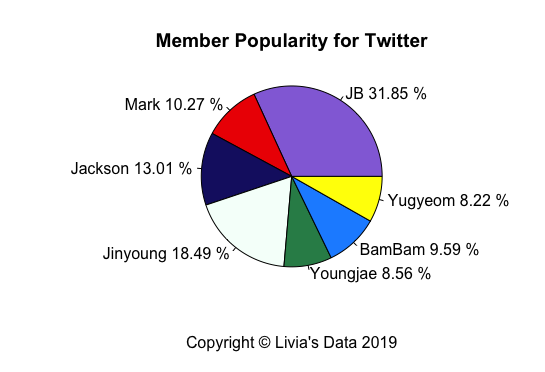
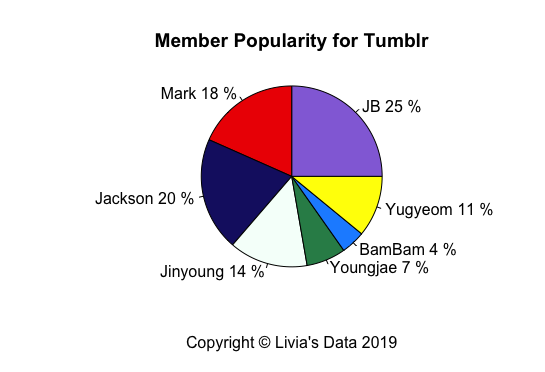
I also decided to give looking a popularity for each platform a try. I only created charts for Tumblr and Twitter as they each earned more than 30 votes.
At roughly 50% of the votes it would make sense for Twitter to reflect for the most part the same distribution as the overall popularity. The main difference is that BamBam is more popular than Yugyeom and Youngjae. I believe that this can be explained by the fact that I had a supportive share from a very popular BamBam fan account, @97bambams.
As for Tumblr, I was not surprised to find a slightly different distribution. Based on the content and fan blogs on there, I was not surprised to find Jackson and Mark out ranking Jinyoung. By the same token, I knew that there was going to be an even smaller percentage of fans for BamBam.
(Slideshow):


Age:
This one had a similar problem to the "Country" section: a large variety of results. Therefore I've set it up in a similar fashion: a chart with the raw numbers and as a bar graph showing the relative frequencies.
The results of this one were pretty predictable with the majority of takers being in their late-teens and early 20's.

As you can see below, age is a quantitative set of data, which allows me to get down into the a little more nitty-gritty analysis. Below are the numbers that I calculated. After these numbers I will explain what they mean and a few more thing about the graph below. I understand that it's a little too technical, so if you're confused at all, you're welcome to skip, this is just for those who would like to know a little more about what's going on in the chart.
Mean: 21.52
Median: 20
Standard Deviation: 4.47
1st Standard Deviation Range: [17.05, 25.99]
2nd Standard Deviation Range: [12.58, 30.46]
3rd Standard Deviation Range: [8.11, 34.93]
95% Confidence Interval of the Mean: [21.21, 21.82]
Because the mean (average) and median (middle) are pretty similar, I can draw the conclusion that the data is close to being normally distributed. The data is skewed to the right, but the weight of the left does balance it out, allowing for a mostly normal distribution. The 1st Standard Deviation Range (where 68.3% of the data lies) is between 17.05 and 25.99. The 2nd Standard Deviation Range (where 95.5% of the data lies) is between 12.58 and 30.46. The 3rd Standard Deviation Range (where 99.7% of the data lies) is between 8.11 and 34.93. With a 95% level of confidence, the true mean of the entire population is between the ages of 21.21 and 21.82.

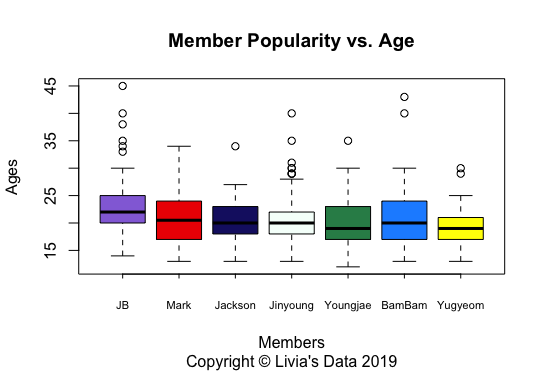
Now I will move onto a question that people will be more interested: who is the most popular with which age group? I will first do this doing the raw data, but will look at this again in the next section in a slightly clearer way. In the graphs below, I have this set up in a box and whisker plot.
How to interpret a Box and Whisker Plot:
The dark middle line in the box represents the median for that given subset. The box around that line are the lower and upper 25% percent (also known as the quantiles). The relative size of these sections indicates the dispersion, i.e. the smaller the area, the more values are in that range and vice versa. The lines, or "whiskers" are the upper and lower extremes. These are the reasonable extremes that R has determined. The dots indicate outliers, because of the sample size, there is to be expected large number of outliers.
Age Distribution of Fans per Member:
As you can see, the median age for each member is roughly the same, though with JB being noticeably more popular with the older middle age group. As the most popular member, it would make sense for JB to have a large dispersion. He also appears to be more popular with older fans relatively, unlike Youngjae. Mark seems to be have the largest dispersion but no outliers. Jackson and Jinyoung have a tighter dispersion with Jinyoung having more outliers. As the youngest members, it would make sense for Youngjae, BamBam, and Yugyeom to be more popular with the younger fans on average.
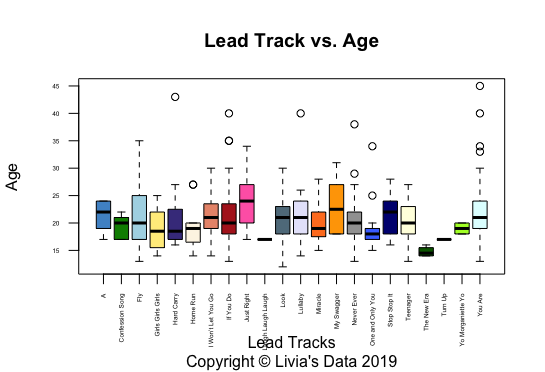
Age Distribution of Fans per Lead Track:
For songs it is much less clear ---- it's a mess, honestly. There is no trend to median placement, no trend to dispersion. This is what you get when you have 22 songs I suppose. I am going to leave out an analysis for this one beyond what I have said as I can't seem to find a rhyme or reason as to why these dispersions have worked out the way they have.
(Slideshow):


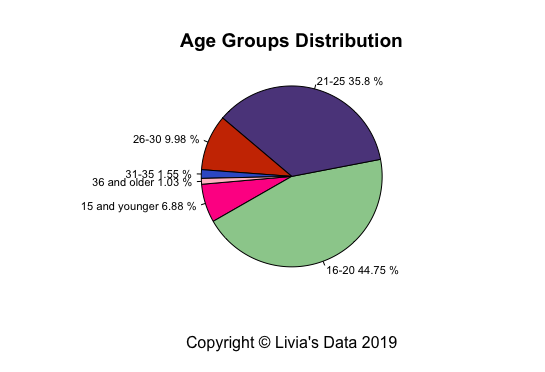
Age Groups:
Because of the wide range of ages and the volume, I elected to group them as the following to figure out who is the most popular with what age group.
15 year olds and younger ---- 40
16 - 20 year olds ---- 260
21 - 25 year olds ---- 208
26 - 30 year olds ---- 58
31 - 35 year olds ---- 9
36 year olds and older ---- 6
(Slideshow):


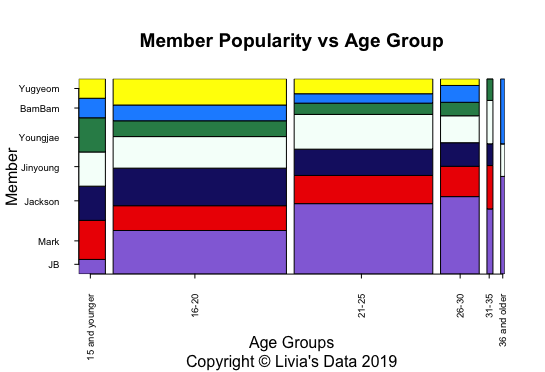
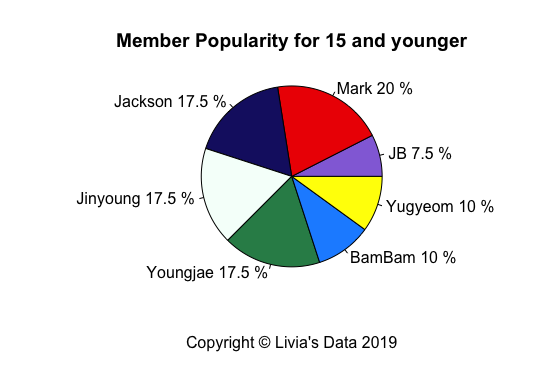
15 year olds and Younger:
While not the largest age group, I believe this one to be most telling. They seem to be drawn towards those who are more, I suppose, more inline with what is considered the ideal appearance of an idol. They all have a certain look about them and I don't know how else to describe it.
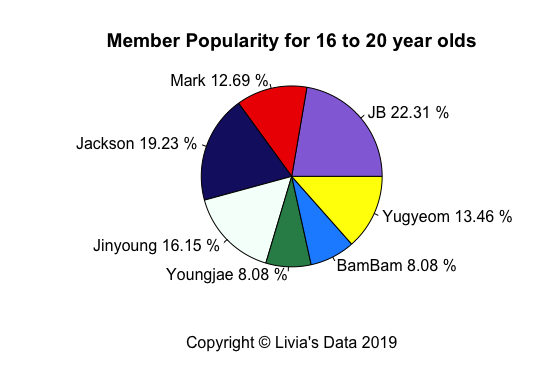
16 - 20 year olds:
As the largest age group this reflects the overall popularity distribution well.
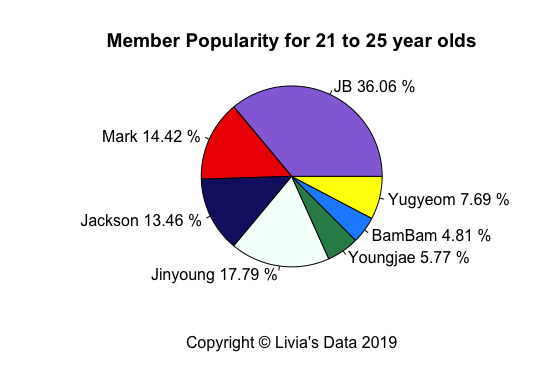
21 - 25 year olds:
As the second largest age group, this is almost identical to the largest age group.
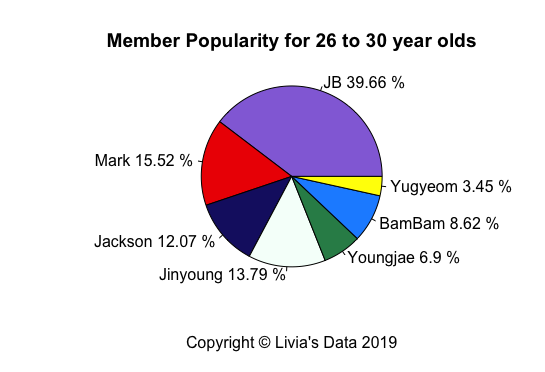
26 - 30 year olds:
Here there is a greater partial towards the Hyung Line, for what I believe to be for the display of maturity.
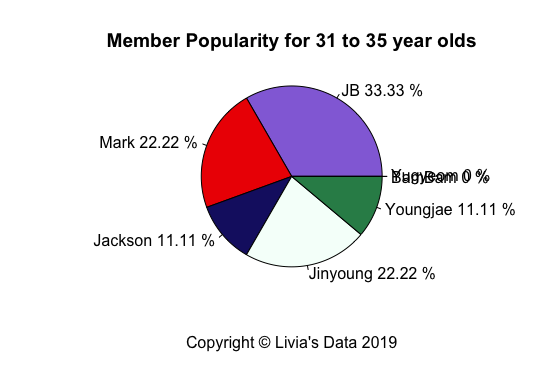
31 - 35 year olds:
At this point I believe we'r looking at maturity and age preference for sure as BamBam and Yugyeom drop off entirely. This is under the assumption that despite there being less than 30 votes this is relatively accurate.
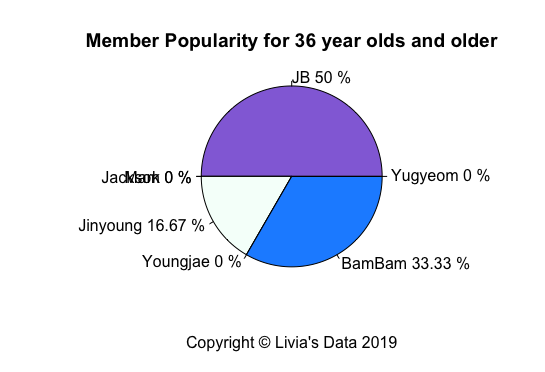
36 year olds and Older:
As the smallest group and votes, I think this came out interesting with JB as the obvious most popular followed by BamBam then Jinyoung. Because there are less than 30 votes, there is no way for me to analyze properly.
(Slideshow):


Region:
Like last time, I also did analysis based on region to give a fair look into each area. I feel that the graph below is pretty self explanatory. After all, I think the fact that over 80% of the votes come from locations that speak either English as their primary language or its one of the most spoken languages really contributes to the popularity distribution that we see. The slideshow only indicated the regions that received more than 30 votes.
Africa ---- 2
East Asia ---- 169
Europe ---- 105
North America ---- 246
Oceania ---- 18
South America ---- 36
West Asia ---- 5

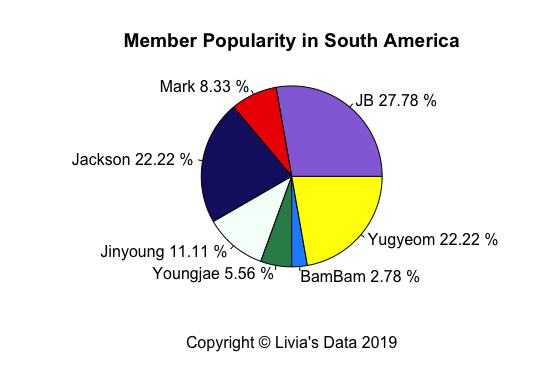
South America:
To be honest, I'm, not quite sure why the distribution came out the way that it did. My guess is that JB has the advantage of being leader and culturally there is an emphasis on dance, which could explain why Yugyeom is the second most popular. As for the rest, it could just be chance.
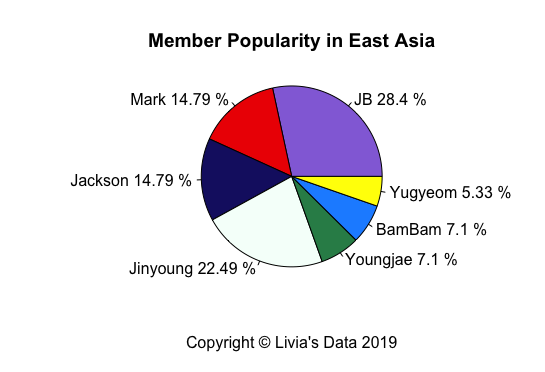
East Asia:
I was pleasantly surprised by the amount of data collected from East Asia. Even though it was mostly Indonesia and the Philippines, I think it does give a good idea of popularity for the big three where K-pop is most prevalent (China, Korea, and Japan).Culturally, it's normal for the Hyung Line to be the most popular, and it certainly shook out that way for GOT7.
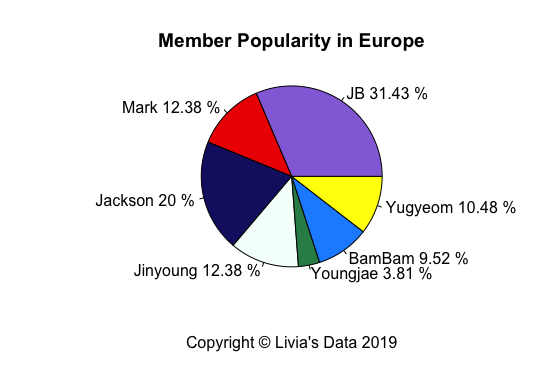
Europe:
This one is definitely more in line with what has been seen overall. With the exception that BamBam and Youngjae switched places and theres a greater difference between the two. I think this can be contributed to the lack of exposure for Youngjae.
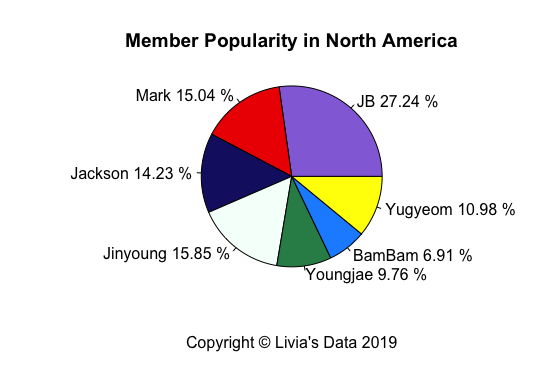
North America:
This one reflects the overall population the closest with the acceptation of Jackson and Mark, but the closeness between Jackson, Mark, and Jinyoung makes up for this as they are statistically the same.
(Slideshow):


Fan Duration:
This is a new section that I've added. And quite honestly, it came out better than expected.
The point of this section is to get an idea of how long someone has been a fan.
Year:
Based on the chart below we can see that the majority of people have become fans of GOT7 in 2018. The best I could figure as to why there was a spike in 2018 was that it was 4 years after they debut, which from my understanding is typically when musical groups' discoverability increases (from my understanding this is the rule of thumb for the greater musical community at large, not just in Korea). In 2018, GOT7 was extremely active, which boosts exposure.

It's a little chaotic, but for the most part, the proportionality stays the same. I am not going to go over this since I think the data speaks for itself at this point.

Quarter:
I've taken this even further by breaking this down into quarters as well. I felt that asking for fans to consistently rem what month they became fans was a bit overkill and would've been a bit unfair, especially to those who had been fans for awhile. Initially I tried to make this a pie graph but it had the same issue as the Country and Age sections: too much data to be able to easily read the graph.
So instead I opted for a bar graph. Different years are grouped together by color, with varying shades to distinguish by quarter. Based on the graph below, excluding Unknown, Debut and 2019 (because these were already broken down as far as I could take them, it appears that the 4th quarter (October through December) for almost every year seems to be the highest. I believe this can be contributed to End of Year shows where people will perhaps either watch them live or get them on their suggested lists on YouTube and other social media.

While graphics are great, it's a little hard to tell the actual breakdown without numbers, I have also constructed a table to break it down even further. Once again percentages are based on the relative number in comparison to the total. The yellow cells indicate the highest quarter for that year. You'll notice that the percentages in the total quarters row do not necessarily add up to 100%. The reason for this is that I wasn't sure how to clearly include the percentages for Debut and Unknown to that row when they are already there in the last column. So just add the green and orange percentages to that final row and you'll find that they equal to 100%.
Looking at this graph, it further confirms my suspicions that the majority of fans found this group during autumn/winter.

Discovery:
This is a next section that required a lot of work on my end. I had to do a lot of re-categorization but I think this covers everything pretty well all things being equal.
Collaborations (Working with another group or artist) ---- 20
Group Interactions (Friendships between idols in different groups) ---- 2
Local Event (Includes conventions, dance events, concerts, etc.) ---- 3
Music Performances (End of the year stages, guest starring, etc.) ---- 43
Streaming Services (Spotify, SoundCloud, etc.) ---- 2
News (Self-explanatory) ---- 13
Other (Self-explanatory) ---- 2
Parent Company (Following the activity of the parent company or a sibling group) ---- 15
Social Media (Instagram, Twitter, Facebook, etc.) ---- 31
Friend (Self-explanatory) ---- 187
Family (Self-explanatory) ---- 8
Television (Through a tv show or movie, excludes Variety Shows) ---- 102
Variety Show (It's own category as they cover TV, Musical Performances, and sometimes another category) ---- 8
Unknown (Th taker cannot remember how they discovered the group) ---- 24
YouTube (Recommendations, deep dive, etc.) ---- 171

I think that 'YouTube' and 'Friends' are the most obvious ones for everyone as everyone has access to YouTube or something of that nature and we all have a friend that is more than willing to drag us into a new group.
I do think however, 'Television' is inflated as Dream High is extremely popular and the GOT7 documentary (Real GOT7, I don't think it's on there anymore) on Netflix would really catch people's eye. Most groups do not have this sort of activity on television.
As for popularity versus discovery, I believe that that really is no trend that method of discovery would influence your preference as all the categories that received more than 30 votes reflect a similar distribution to the overall popularity of each member.

Ending Notes:
Thank you to everyone who participated in this survey. I hope you all found this to be interesting. This was a learning experience (in case you couldn't tell) and as such, I would appreciate it of y'all would consider it as such. I am open to suggestions and criticisms on how to improve from here on out.
I am going to be trying to promote a new way, so that way my data is a lot fairer. I am going to be trying harder to reach fans in a Asia. I really want to get everyone's opinion and I don't think I've done fans in Asia (or anywhere really, but I really did badly with them because they're suppose to be one of the biggest groups of fans for this genre of music) any favors. So when I have a larger following on Twitter and when I've figured out how to contact fan accounts better, I might redo this along my other surveys.
Also, thank you to everyone who shared my survey. I've tagged all the people who I know shared my survey through Twitter and Tumblr. You're welcome to finish here, but please stick with me for a little longer to take a look at current open surveys, future projects, and how to share this on social media if you'd like to.
This analysis has been edited to reflect the correction of mistakes.
Edited May 27th, 2019.
Cover photo provided by Tone Deaf.
In honor of the comeback.
Projects and Sharing:
For those who are interested, below are a list of projects and how to share them. When I publish results, I tag those who have shared it on that given social media platform. I believe in giving credit where it's due and if you shared it, you deserve to see the results and be acknowledged, you've contributed to me getting more information.
Where to follow me:
GOT7 Results:
To Share on Tumblr
To Share on Twitter
Current Projects:
Future Projects Survey *Open for the foreseeable future*
Red Velvet Survey *Open until 500 entries are received*
EXID Survey *Open until 500 entries are received*
BLACKPINK Survey *Open until 500 entries are received*
Monsta X Survey *Open until June 7th, 2019*
VIXX Results:
To Share on Tumblr
To Share on Twitter
BTS Results:
To Share on Tumblr
To Share on Twitter
EXO Results:
To Share on Tumblr
To Share on Twitter


Comments